🚧 Early alpha Under active construction. Everything here may change without notice — except the appcast URL. That one's forever.
Early alpha · v0.8 · macOS
Your Mac runs agents now.
Run it like an operator.
Aetower is the operator console for the machine your agents run on. See friction, energy, money, disk, and repo impact from day one — grow into incident playback, storage reclaim, fleet views, and agents that inspect their own runtime over MCP. Nothing leaves your machine unless you export it.
Why this exists
Agents are workloads you didn't schedule
Coding agents, local models, background inference — they launch processes, spawn helpers, and keep working while you're in a meeting. Your Mac became a small datacenter, and nobody was watching it.
They spend real resources
Aetower translates local activity into practical resource-cost rollups across repositories, sessions, processes, and the machine — estimated watts, energy, battery impact, dollars, carbon, disk growth, and thermal contribution, each with its source and confidence, from one consistent model. The cost of a background run is a number, not a fan noise.
The watcher must be local
You can't observe your own machine through someone else's cloud. One local engine serves the app, the CLI, and an MCP server — so you and your agents read the same live truth, and it never leaves the Mac.
The operator's ladder
Aetower meets you where you are — from your first agent install to running a small fleet. Each rung works on day one; none of them requires the previous.
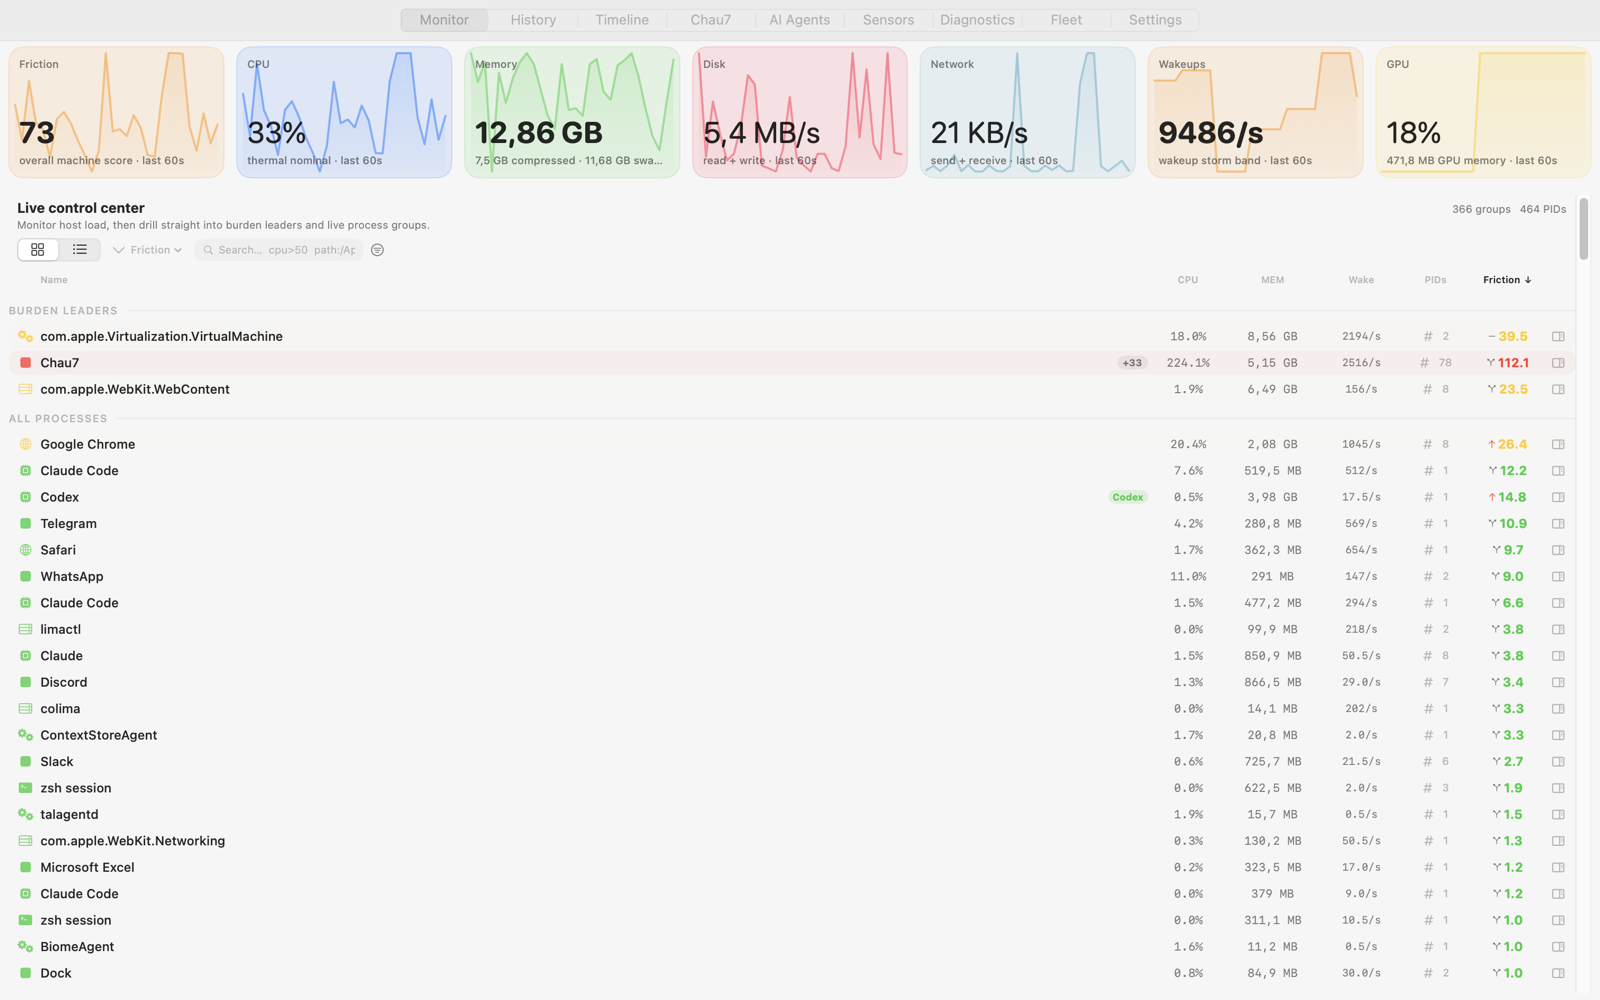
See what's running and what it costs
Every app, daemon, and agent is one entity with one 0–100 friction score. The loudest thing is at the top, and each one comes with a recommendation in plain English. No dashboards to learn, no metrics to configure.
- Entity grouping: Chrome plus 47 helpers is one row, not fifty.
- The AI-tax panel: inferred GPU share, unified-memory pressure, and kernel-measured energy per agent — each labeled with its source.
- Recommendations that adapt to battery, thermal state, and memory pressure.
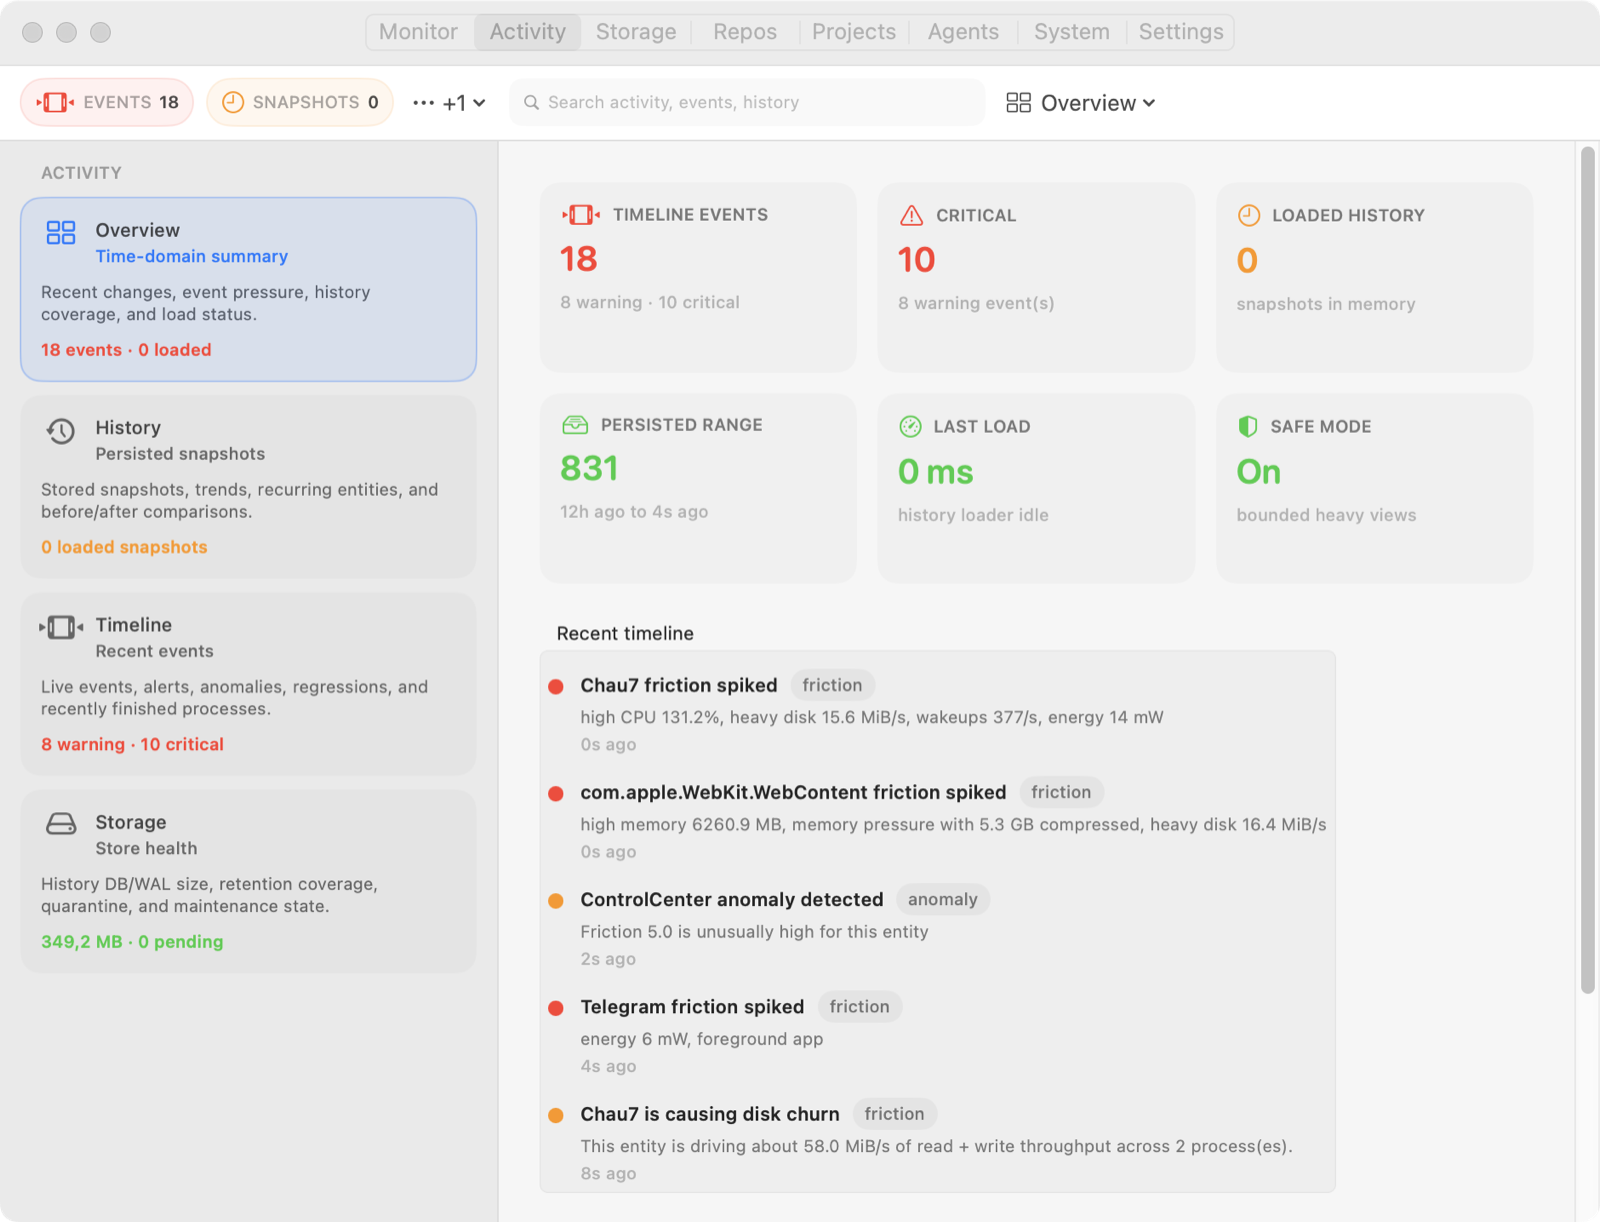
Reconstruct what happened
The first time your Mac locks up mid-demo, you'll want the morning back. Activity keeps bounded local history — with regression analysis up to seven days when retained — and a timeline that reads like an incident report, so "what was running at 2 PM" is an answerable question.
- Scrub through history: friction, CPU, memory, and disk per entity, at capture cadence.
- Spikes, thermal escalations, restart loops, and agent session costs on one feed.
- Reverse pivots: which process holds this file, port, or socket.
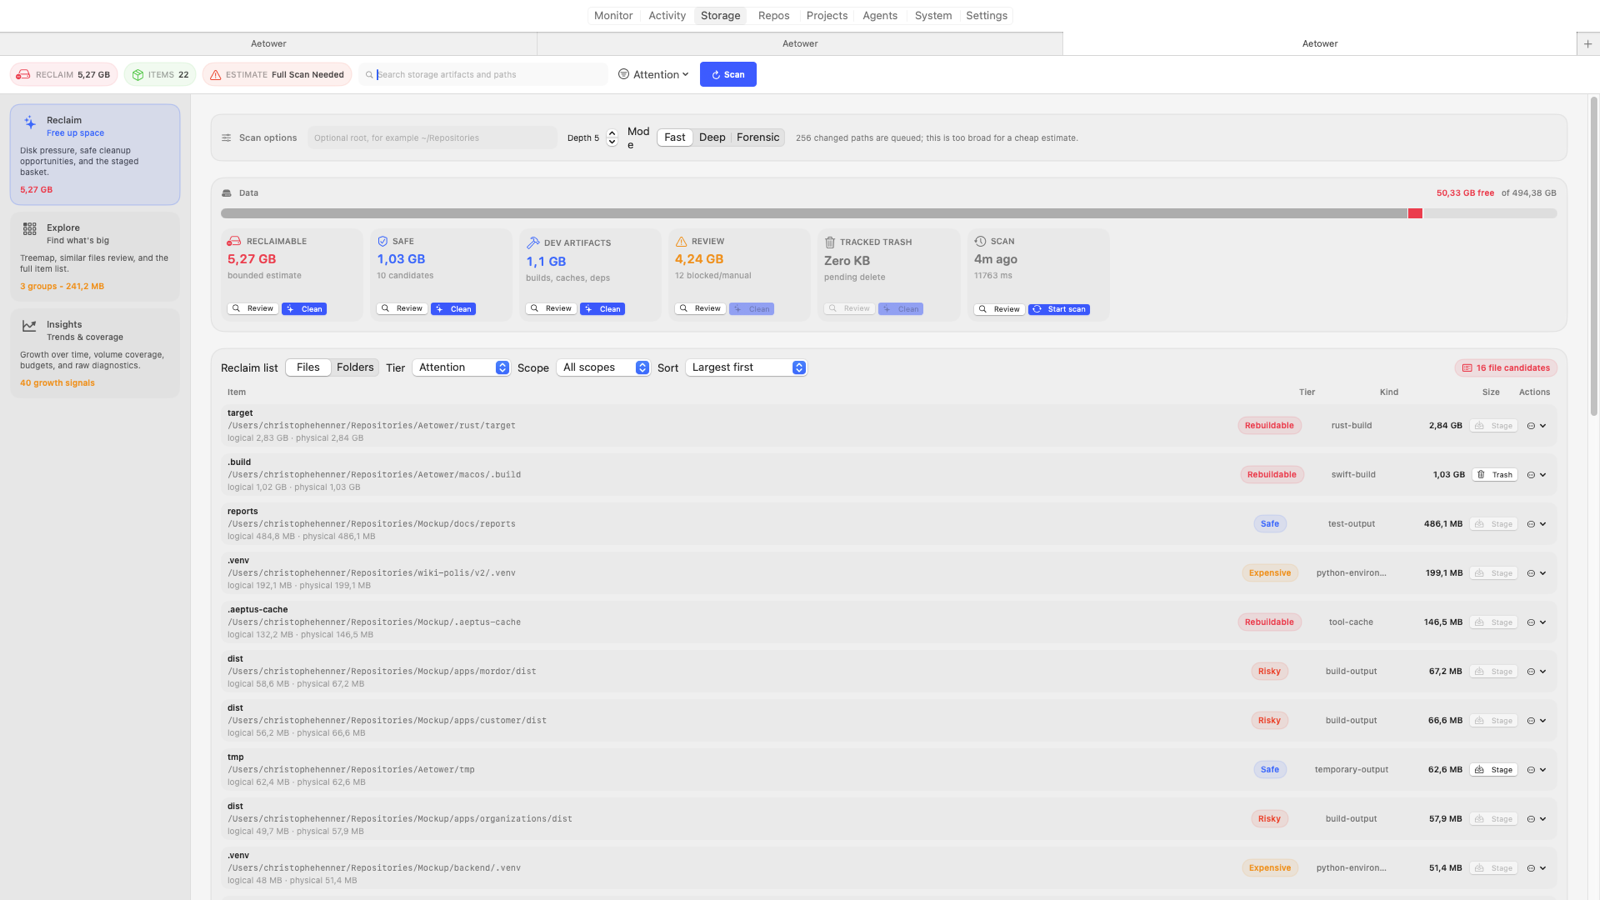
Reclaim what agent work leaves behind
Agent-heavy work fills disks: build artifacts, caches, model weights, spare clones. Storage keeps a persistent index that explains what grew and what wrote it, then stages safety-tiered cleanup through the Trash — verified, APFS-aware estimates and per-path outcomes, never a blind delete.
- A treemap and full-index explorer to find what's actually big.
- Growth attribution with filesystem evidence: which roots grew, and why.
- Rebuildable artifacts first — node_modules, target/, DerivedData — staged, not deleted.
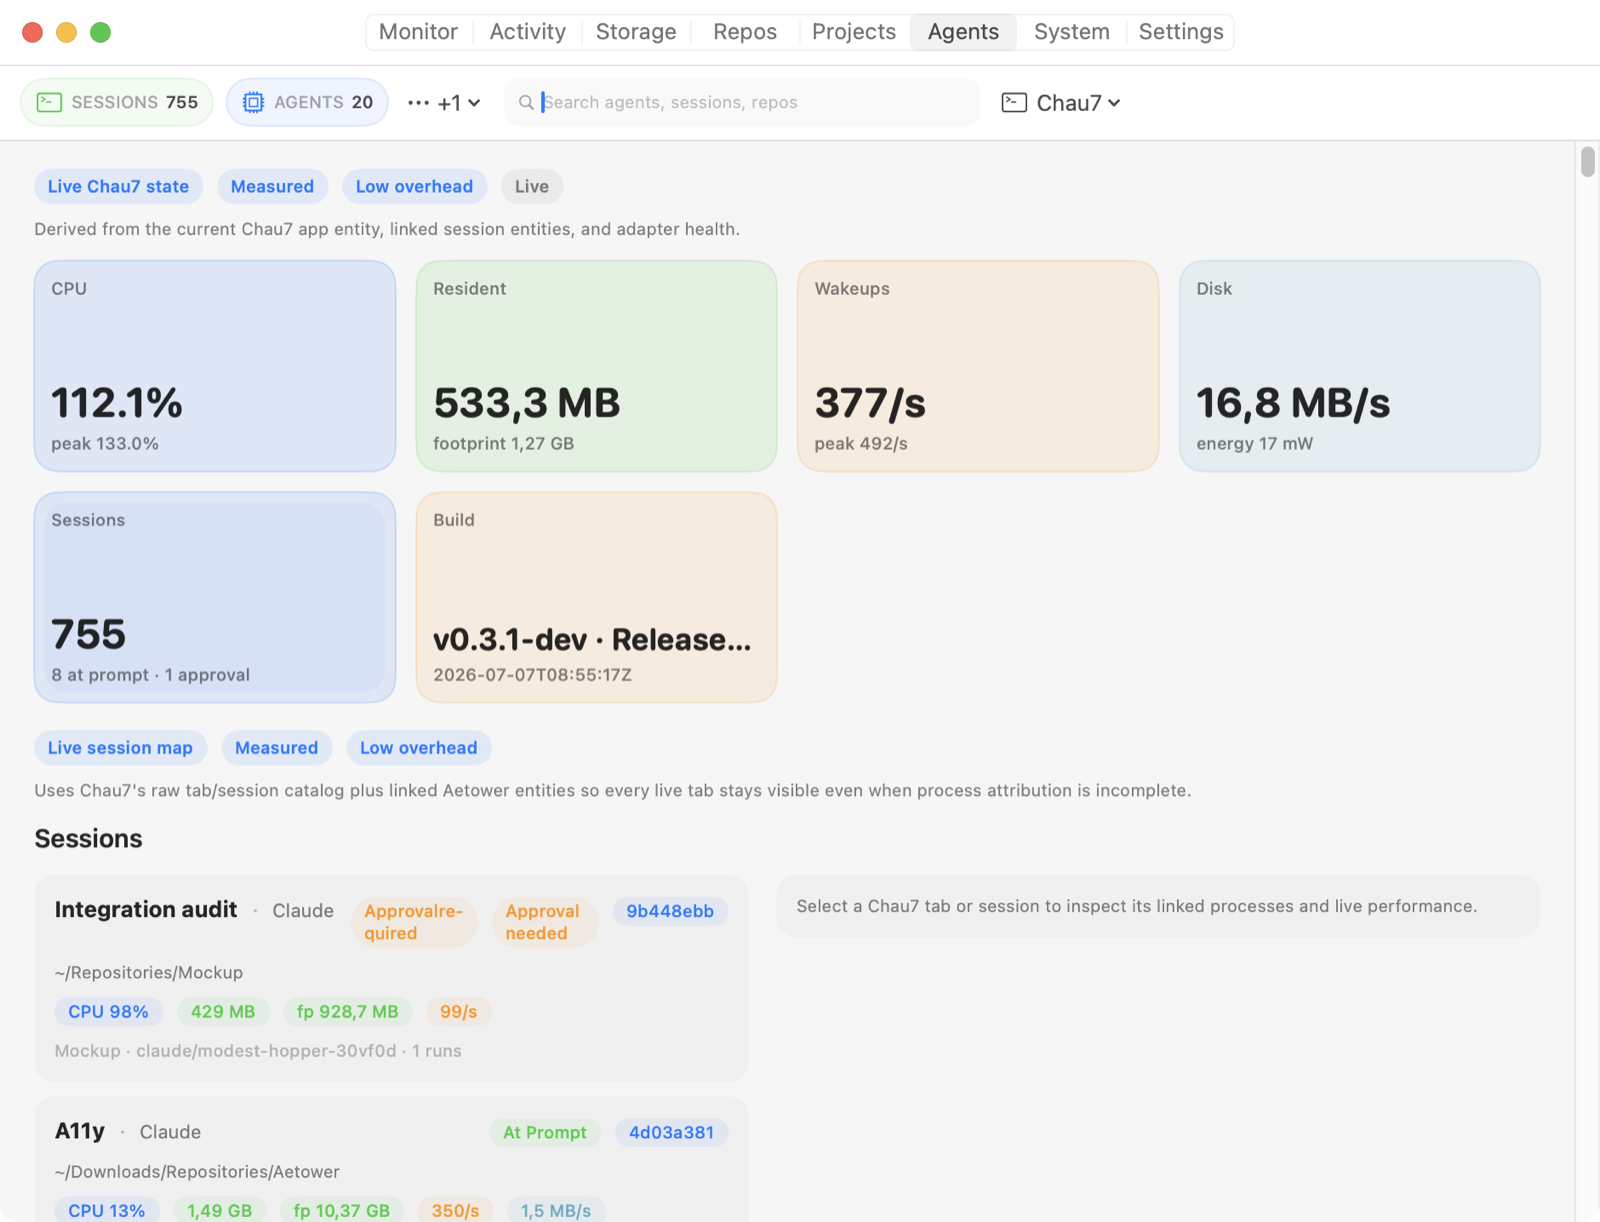
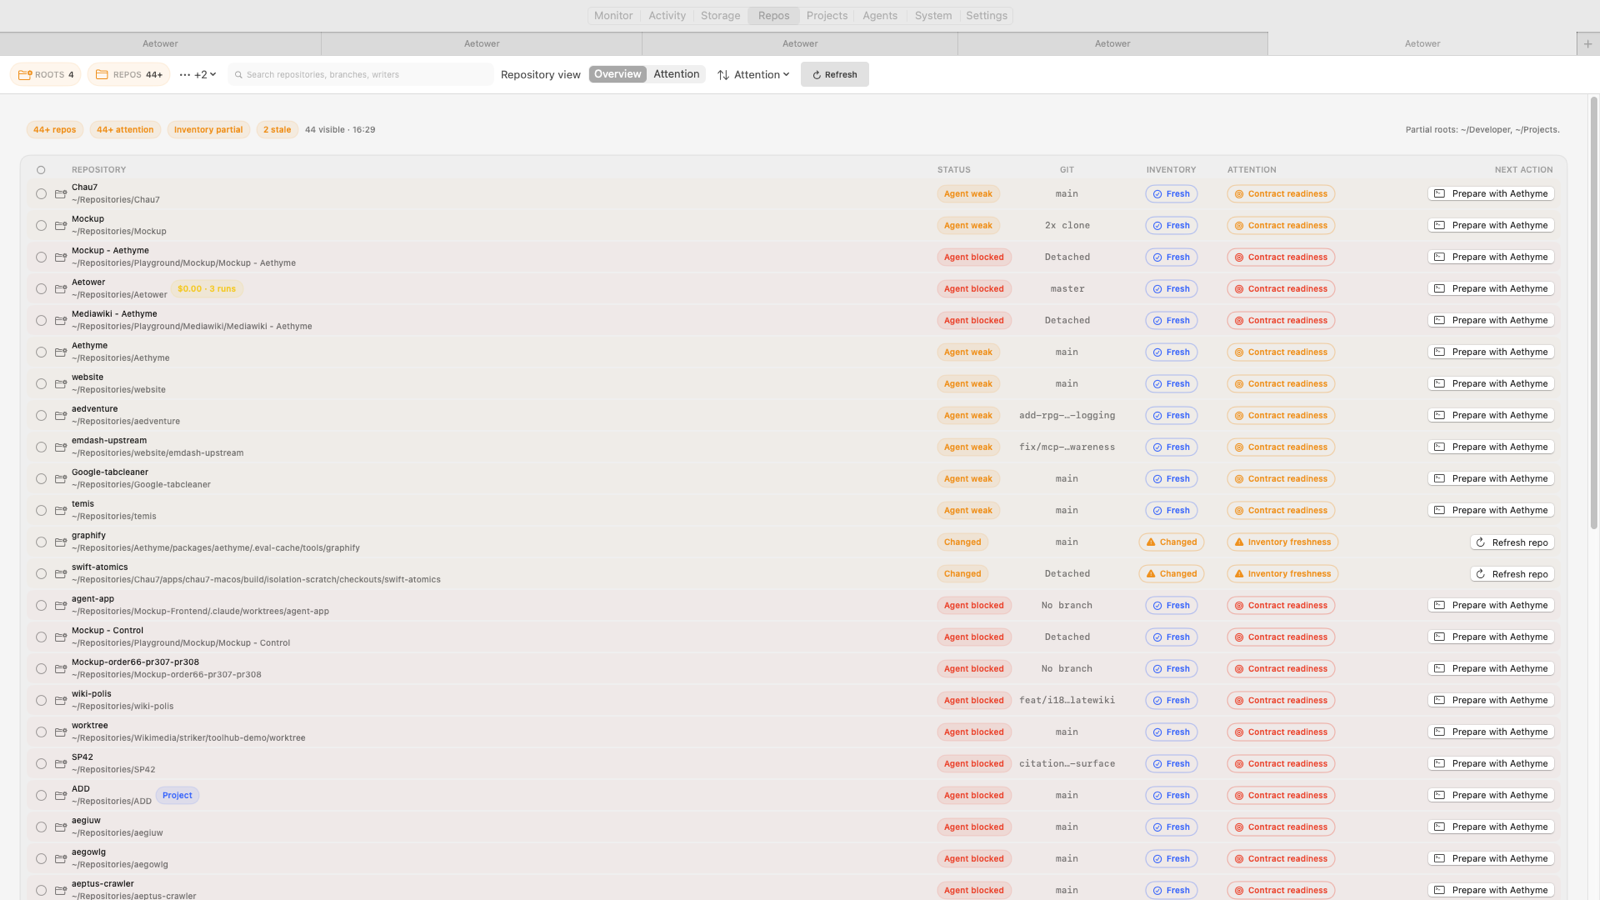
Ready your repos, watch every machine
Agents work on repositories and across machines. The Repos tab joins storage pressure, Git state, duplicate clones, per-repo cost rollups — dollars, tokens, and, when attribution is strong enough, estimated energy and carbon — and operating-contract readiness; Fleet shows every nearby Mac running Aetower with Fleet enabled — zero server, no account.
- Check AGENTS.md readiness before pointing an agent at a repo.
- Provider actions: re-run failed GitHub workflows, redeploy Cloudflare Pages.
- Opt-in Bonjour fleet summaries: CPU, memory pressure, thermal state per machine.
The top of the ladder
One engine — for your agents and your shell
The app owns a local MCP server on a Unix socket — one engine, no second collector. Your agents query the exact live state you're looking at: 30+ tools for snapshots, history, anomaly explanations, memory breakdowns, storage intelligence, and repo inventory. Read-only MCP by default, with opt-in guarded operator actions — every action preview- and approval-gated.
After a freeze or a pressure spike, one call to aetower_investigation_bundle hands the agent alerts, findings, recent changes, and history diffs for the window — instead of twenty shell commands.
The same socket answers you, too. The bundled aetower CLI is a thin client of that engine — aetower top, aetower storage, aetower repos, or --json into any pipeline — so you read the exact state your agents do, from any terminal. It ships in every download; the PKG and Homebrew tap link it onto your PATH, while DMG/ZIP installs expose the same action in Settings.
aetower_investigation_bundle
aetower_explain_anomalies
aetower_reboot_report
aetower_memory_breakdown
aetower_ai_runtime_report
aetower_wakeup_attribution
aetower_diff_snapshots
aetower_recommendations
you › what's straining my Mac right now?

agent › calling aetower_top_findings…
agent › Ollama (llama3:70b) leads at friction 58 —
        GPU-bound (inferred), 8.1 W. Unified memory at
        78%, near the swap cliff. Consider a smaller quant.
$ aetower top
ENTITY                  FRICTION  CPU%      MEM
Chrome · 48 procs             72   139   1.2 GB
Ollama · GPU 8.1 W            58    12   9.1 GB
Claude Code · repo x          14     0   340 MB
# One-click registration for Claude and Codex in Settings;
# manual config for any MCP client:
{
  "mcpServers": {
    "aetower": {
      "command":
        "/Applications/Aetower.app/Contents/Helpers/aetower-mcp"
    }
  }
}

# Read-only by default; operator actions are opt-in,
# preview- and approval-gated. Exports are privacy-tiered
# and redacted. Registration is always an explicit opt-in —
# Aetower never writes client config on its own.
Plays well with your stack
CLI
aetower top, aetower storage, aetower repos — or --json into any pipeline. PKG and Homebrew tap installs link the command automatically; DMG/ZIP users can enable it from Settings.
OTLP → Grafana
Optional metrics export with a documented reference and a ready-made dashboard.
Docker
Local container metadata joined to the entities that own it.
Chromium debug
Tab-level attribution through compatible debug endpoints.
Shortcuts & shell hooks
Process events can trigger your own automations.
What it inspects
Process pressure
CPU, threads, friction.
Wakeups & energy
Battery, cost, carbon.
Memory
Footprint & leaks.
Storage
Growth, cold data, reclaim.
Code-signing
Unsigned / ad-hoc.
Persistence
Agents, daemons, cron.
Agent impact
Timelines, sessions & MCP.
Repositories
Clones, contracts, spend.
Versus the usual suspects
Built like it preaches
Local-first
Runtime history and diagnostics stay on your Mac unless you explicitly export them.
Conservative
Everything outbound is off until you opt in — and Privacy → Outbound Data shows each channel's live state: telemetry, Fleet advertising, hash-only VirusTotal lookups, provider credentials, and registered MCP clients.
Open source
AGPL-3.0, with every binary release paired with its exact corresponding source archive.
Watches itself
The Diagnostics tab turns Aetower's own pipeline into the same observable surface it gives your apps.
Developer Preview
Join the preview deliberately
Aetower is an early-alpha Developer Preview: signed, notarized, and auto-updating through Sparkle — and moving fast. Surfaces evolve between releases, and feedback steers what hardens first.
It's built for technical people who understand macOS permissions and want a say in what an agent-era operator console becomes. If that's you, you're early on purpose.